Packages, models, datasets and analyses — each one a star in the ZNSTARS constellation.
Python package
ActSim: actuarial risk modelling and simulation
Of the Actuary, By the Actuary, For the Actuary — ActSim is a Python package for actuarial risk modelling and simulation.
Risk modelling – fit severity and frequency distributions to empirical data and evaluate goodness‑of‑fit metrics.
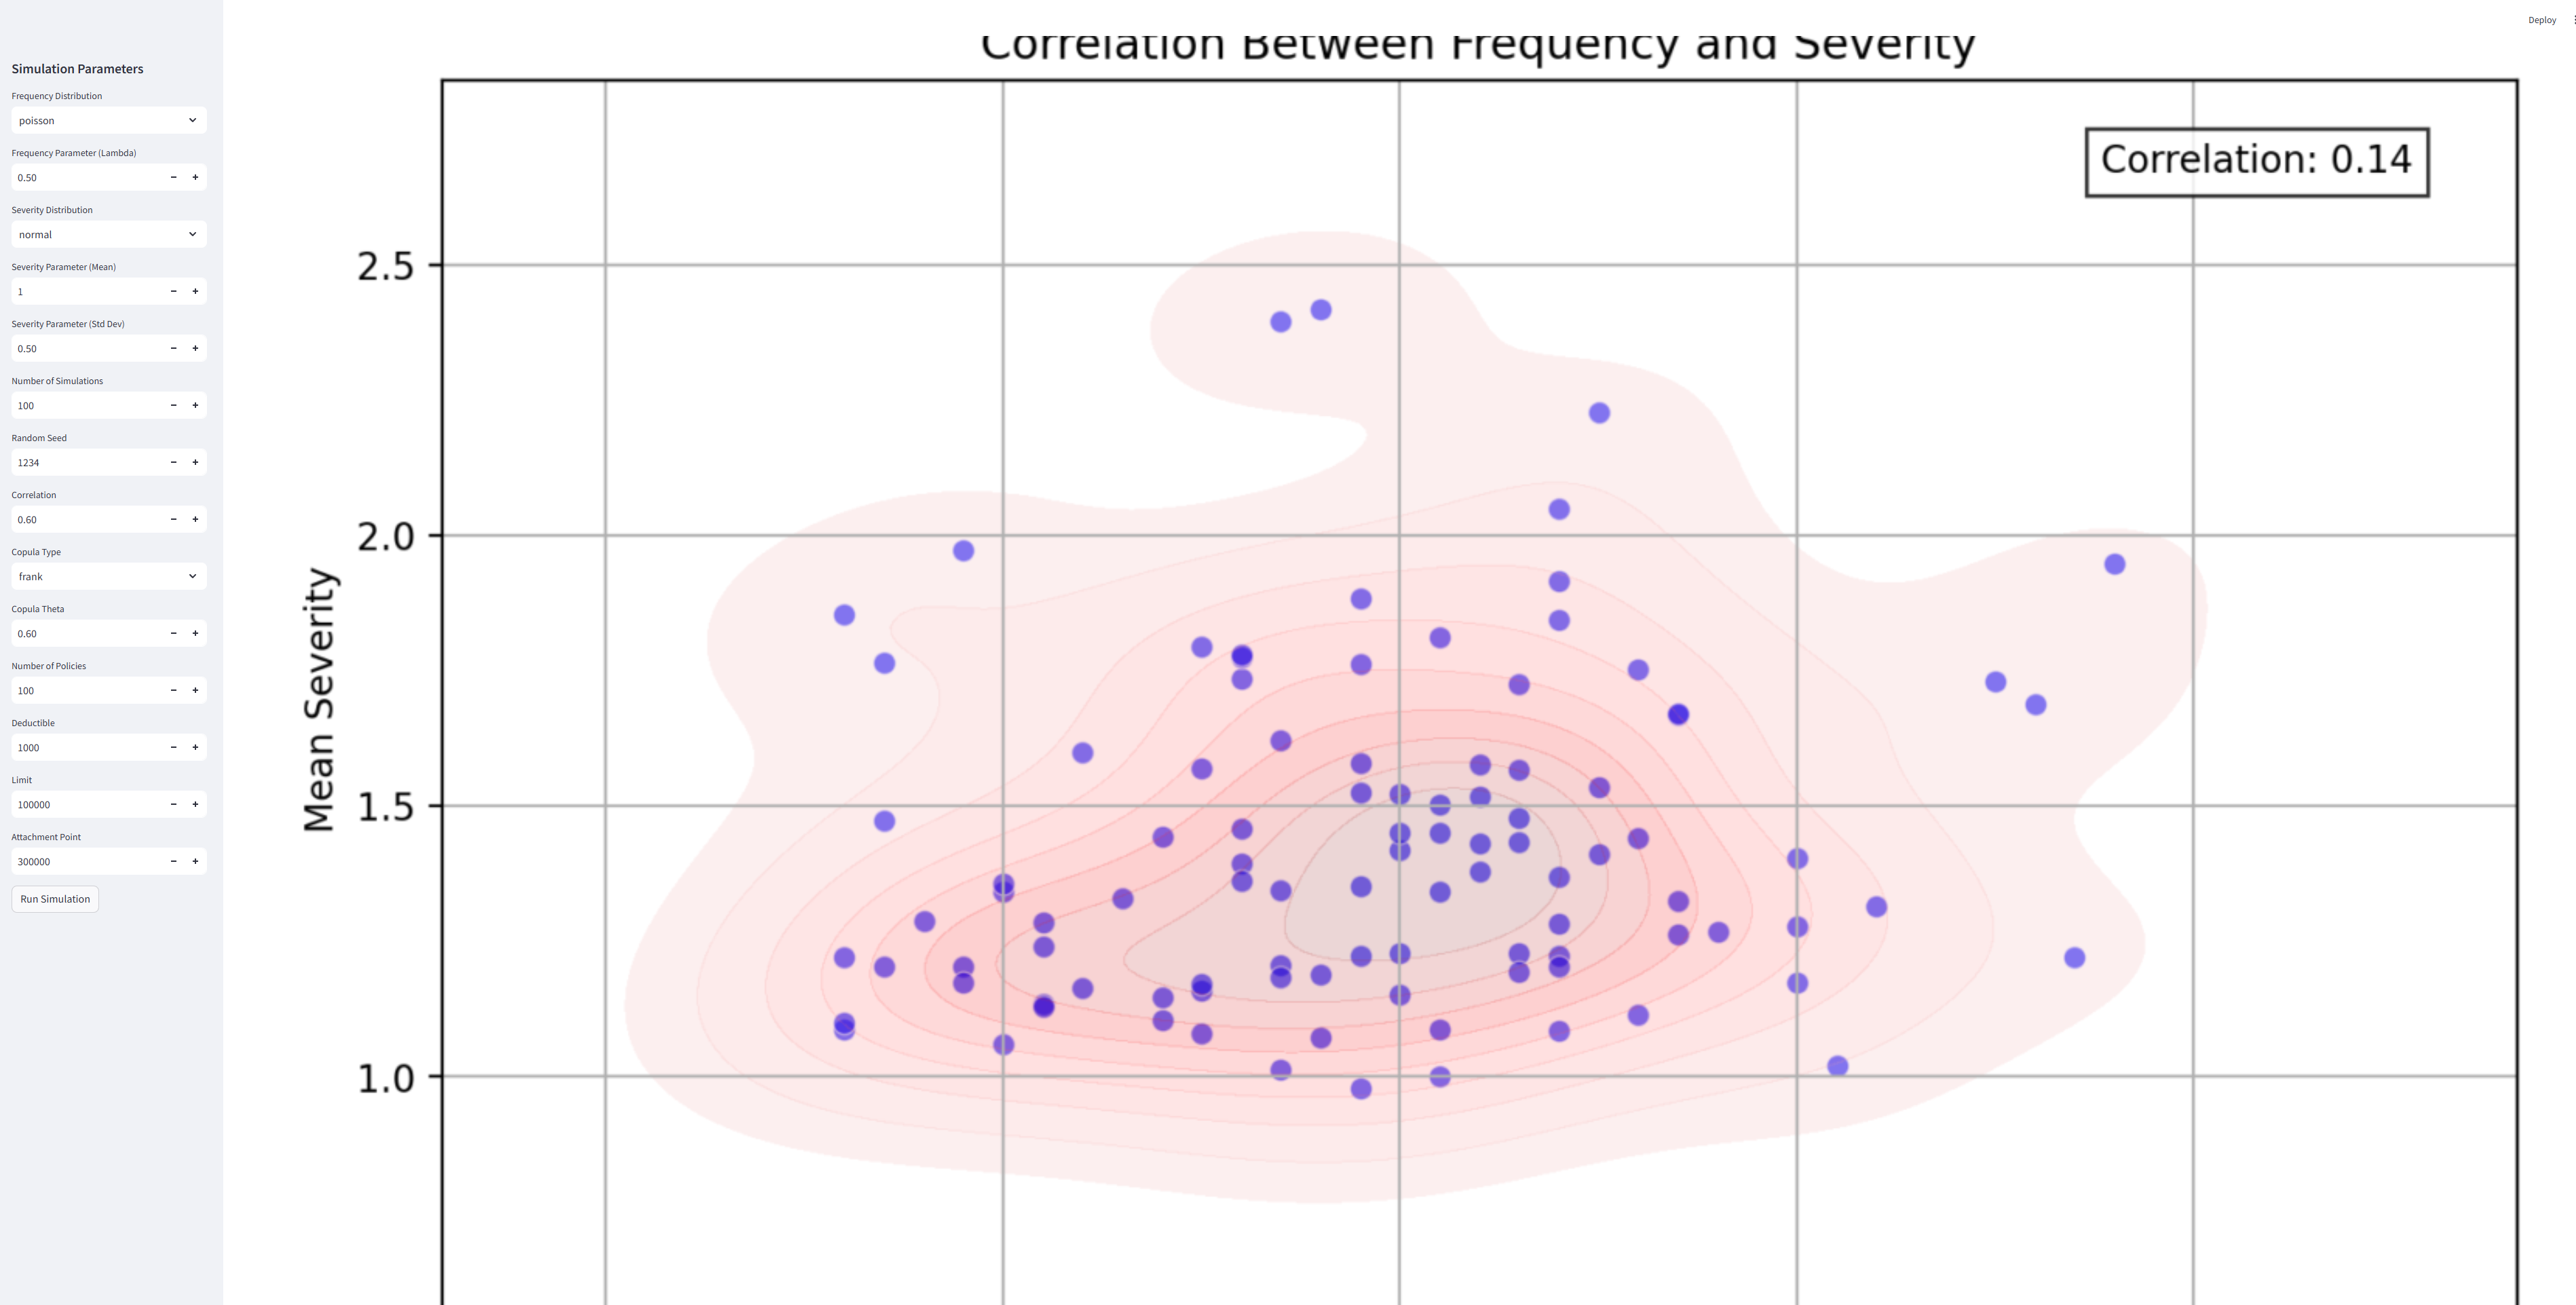
Monte‑Carlo simulations – high‑performance engine for aggregate loss modelling and multivariate simulations, with support for copulas and linear correlation.
Configuration management – YAML files specify which distributions and metrics are available; load the default or supply your own.
Synthetic claim simulation – claim counts and severities per policy, occurrence dates via non‑homogeneous Poisson processes, and development data from specified LDFs.
ActLLMInfer: one inference API across LLM providers
An integrated LLM inference engine with a LangChain‑Core‑style interface — one small package and one consistent API across the major US and Chinese chat‑LLM providers.
Eight providers – OpenAI, Anthropic, DeepSeek, Moonshot (Kimi), ZhipuAI (GLM), MiniMax, Hugging Face and NVIDIA NIM.
Unified completion() endpoint – LiteLLM‑style dispatch from a single provider/model string, with OpenAI‑shaped responses, streaming, embeddings and async variants.
Fallback router – retries transient errors so a rate‑limited primary model falls through to the next provider.
Lightweight – requests is the only required dependency.
Put one decorator on a function that produces results — a report, a model fit, a reserve run. ActDecor runs the function exactly as before, then has an LLM read what it returned and write a short plain-language commentary. You get both back: the original value, untouched, and the commentary.
@summarize_with_llm(
    model="openai/gpt-4o-mini",
    instructions="Flag low premiums.",
)
def run_report(region):
    return {"region": region,
            "premium": 128_000}

r = run_report("US-West")
r.value       # the dict, unchanged
r.commentary  # the LLM's summary
Your code stays as it is – the function runs normally; ActDecor only reads its return value (and, if you ask, its arguments).
Any model, one string – provider/model through ActLLMInfer: OpenAI, Anthropic, DeepSeek, Kimi, GLM, NVIDIA NIM and more.
Your instructions, not a prompt – add guidance such as “respond in French” or “flag any premium below $1,000” and it is merged into the default prompt.
The shape you want back – a SummaryResult object (default), the commentary only, the original only, a tuple or a dict.
Picks the model for you – with ActRouter switched on, the first call sends only the function’s name, signature and docstring — never its data — and gets the best-fit model among the vendors you hold API keys for. The choice is saved in actdecor_inventory.json, so later calls, even in a new process, skip the lookup. Commit the file to pin a model.
The Linkable Open Data Environment (LODE) is an exploratory initiative that aims at enhancing the use and harmonization of open micro data primarily from municipal, provincial and federal sources.
The results are a collection of datasets released under a single open data license (Open Government Licence – Canada), as well as open source tools used to process the data, and collaborations in an open space.
Built upon the LODE, I have compiled the provincial into countrywide data, added an FSA (first 3 digits of postal code) column using a geospatial join, and added an indicator to distinguish between condos and other types of structures.
The complete open address dataset is approximately 1.8 GB, so download when you are connected to Wi-Fi ;)
The LA fire captured everyone’s attention and hearts. I closely monitored its growth, containment efforts, and the potential damage it could cause. As an actuary, I strive to ensure that our work helps people during such crises by advocating for sufficient reserves to support recovery. It’s about more than numbers — it’s about enabling communities to rebuild and return to their homes with resilience and hope.
This flood catastrophe model consists of four key modules:
Hazard – a statistical model of flood susceptibility across regions using a susceptibility map, Canada’s historical flood map, and seasonality adjustments for temporal variation in risk.
Inventory – the exposed assets, with their location, value and structural characteristics.
Vulnerability – damage functions relating flood intensity to asset damage.
Loss – translates damage into financial loss, incorporating policy conditions and reinsurance structures.
High-fidelity synthetic claims data from my Claim Simulator — an actuarial tool that provides realistic, structured datasets for reserving, pricing and risk analysis. Unlike models that rely solely on historical claims, it produces synthetic claim trajectories that reflect real-world development patterns while allowing extensive scenario testing.
At its core is a self-developed distribution fitter, so frequency, severity and development assumptions align with actuarial conventions. Copulas and multivariate correlation structures model dependency across claims, coverage types and accident periods. Output can be structured into loss development triangles, aggregated quarterly or annually, and converted between incremental and cumulative formats.
It enables stress testing, model validation and scenario exploration beyond the constraints of historical data — supporting decisions in reserving, reinsurance structuring and portfolio risk assessment.